Step 1
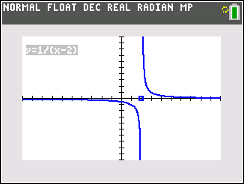
In the first problem, students will explore a position-vs.-time graph. After being introduced to the definition of a function, they will determine if the graph is a function of time, then update the graph to show a function.
Analysis and Approaches | Functions

This activity gives students an opportunity to explore the definition of a function graphically, with a set of ordered pairs, and by using equations to apply function models to real world situations. These models dynamically allow students to discover the function by experimenting with input values that produce the desired output. Function notation will also be reinforced.

In the first problem, students will explore a position-vs.-time graph. After being introduced to the definition of a function, they will determine if the graph is a function of time, then update the graph to show a function.

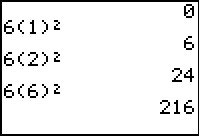
Then students will calculate the output values for given input values using the distance formula d = 0.5at2 for when a = 12 ft/s2. The first set of input values are for t and the second set of input values are for d.
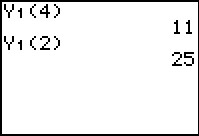
Students will then explore using function notation on the calculator entering input values to find the output value. The given function is stored in the Y= screen.

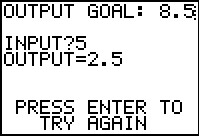
In the last problem, students will use the program MACHINE which acts like a function machine. When they enter an input value, it will return the output value. They are to determine the input value for the goal output and the mystery function.